
Skip to content
Focused Forward
Core service

Real-Time Dashboards

Your data already exists. It is just scattered across spreadsheets, accounting software, CRMs and production systems. We connect it, clean it and present it as live dashboards your leaders actually open every morning.

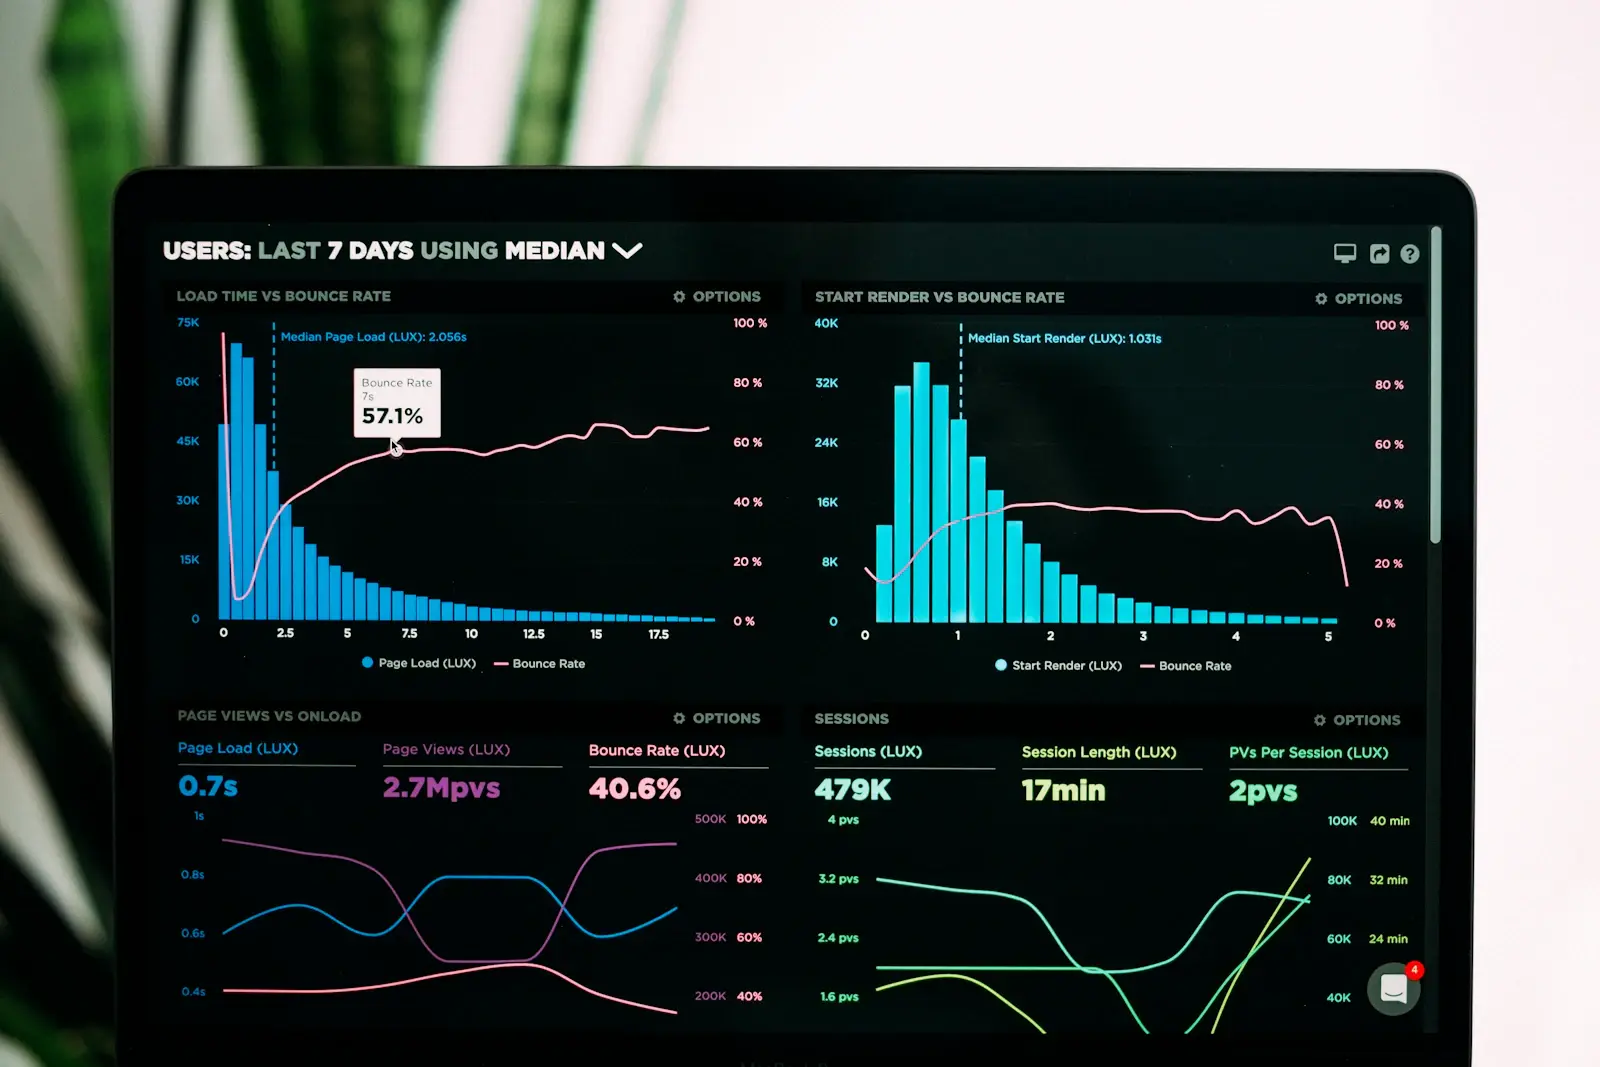
Analytics dashboard with charts on a monitor
  • Live data pipelines
  • KPI design
  • Executive views
  • Alerts
01

One source of truth

Sales, operations, finance and workforce numbers in one place, refreshed automatically.

02

Decisions, not reports

Dashboards designed around the questions your team asks, not around the data that is easy to chart.

03

Catch problems early

Thresholds and alerts surface issues while there is still time to act on them.

Key features

What it can do

  • Connect every source

    Spreadsheets, databases, accounting, CRM, ERP and SaaS tools pulled together.

  • Automatic refresh

    Data pipelines keep numbers current without anyone exporting files.

  • KPIs that matter

    Metrics designed around the decisions each team actually makes.

  • Role-based views

    Executive summaries, manager drill-downs and team-level boards.

  • Alerts & thresholds

    Get notified the moment a number moves outside its normal range.

  • Scheduled summaries

    Daily or weekly digests delivered to inboxes and Teams.

How we deliver dashboards

How we work on real-time dashboards

A clear, step-by-step process with something concrete to review at every stage. No black boxes, no surprises.

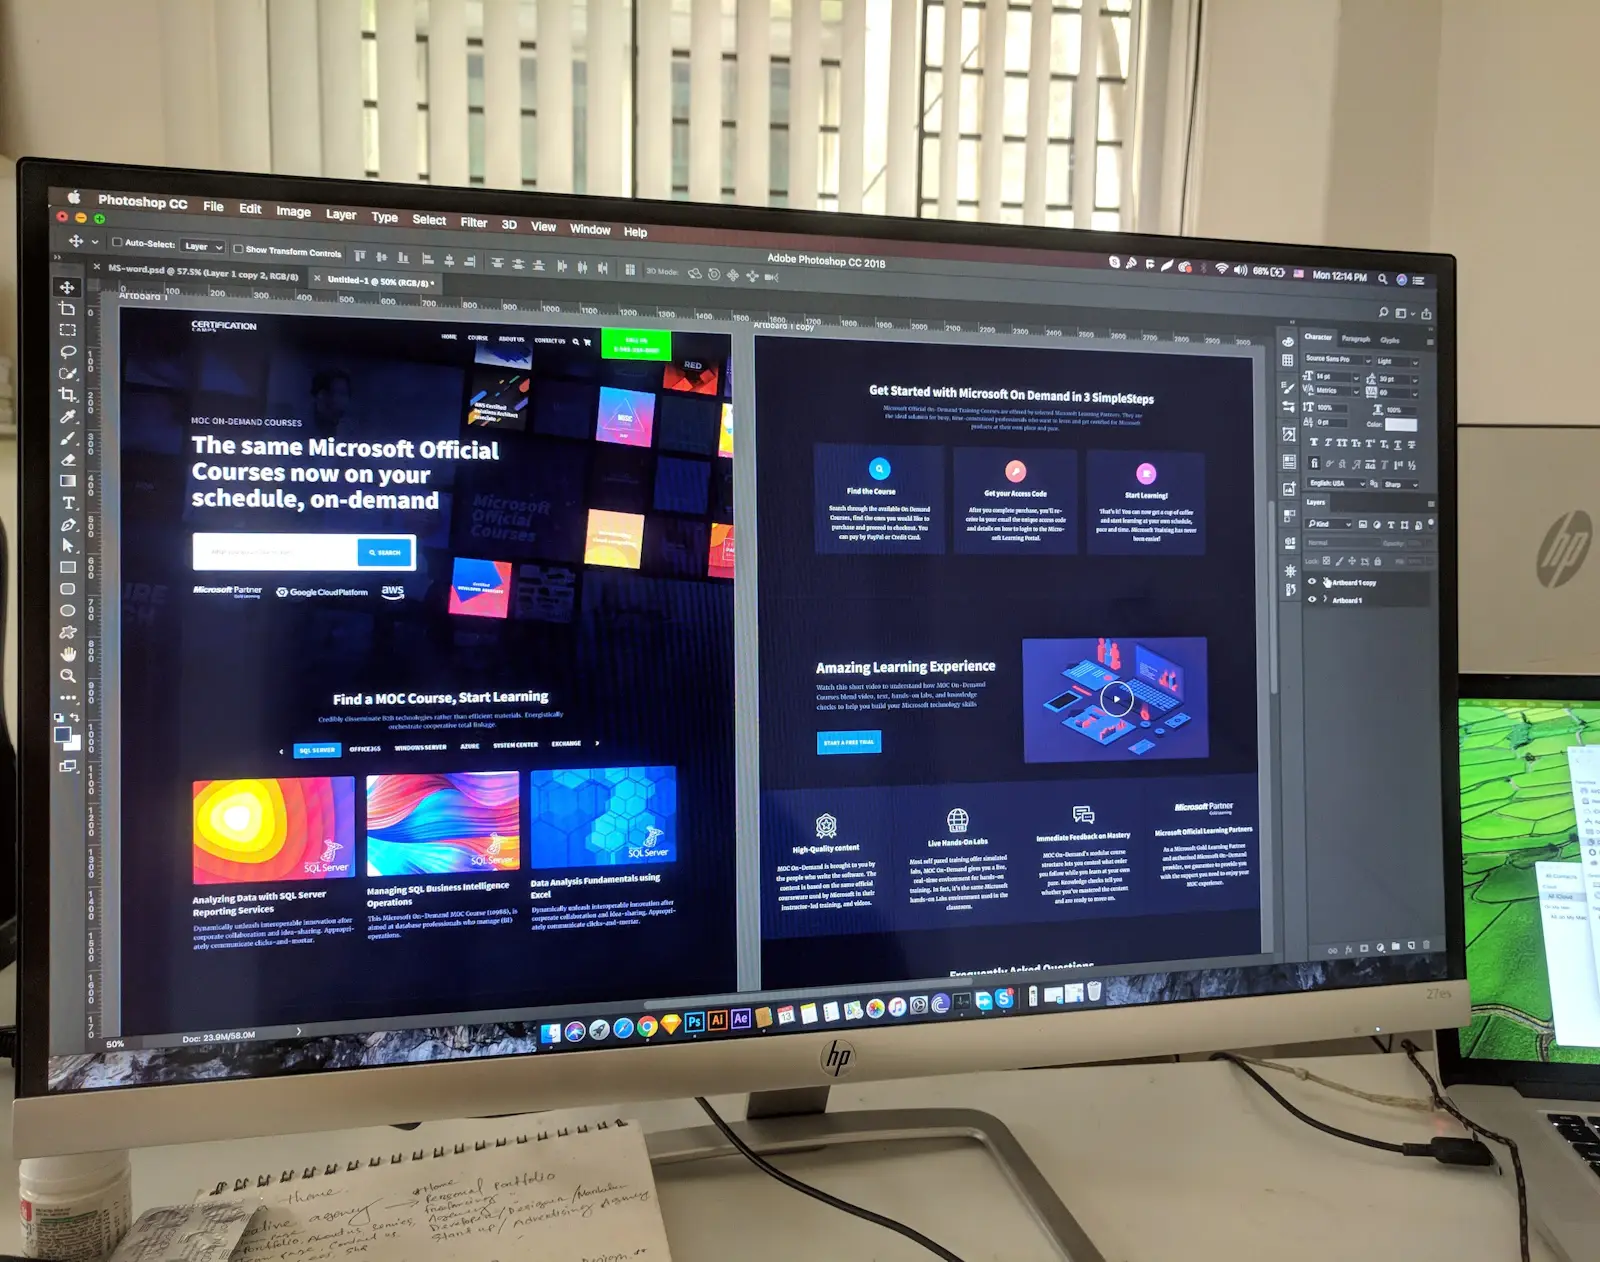
Analytics dashboard interface shown on a large monitor
  1. 0101

    KPI workshop

    We agree which questions the dashboards must answer, who needs which view and how often.

    You getKPI definitions

  2. 0202

    Data source audit

    We map where every number lives, how reliable it is and how it can be accessed securely.

    You getSource map & data gaps

  3. 0303

    Pipelines & data model

    We build automated pipelines that collect, clean and combine data into one trustworthy model.

    You getAutomated data layer

  4. 0404

    Dashboard design

    Clear, uncluttered layouts designed and tested with the people who will use them daily.

    You getApproved dashboard designs

  5. 0505

    Alerts & distribution

    Thresholds, notifications and scheduled summaries so insight reaches people without logging in.

    You getAlerts & digests live

  6. 0606

    Rollout & refinement

    Training, adoption check-ins and new metrics as your questions evolve.

    You getDashboards in daily use

Tools & technologyPower BIPostgreSQLPythonNext.jsAzure DataREST APIs
What's included

What you get

  • KPI workshop with leadership
  • Data source audit and connection plan
  • Automated data pipelines and storage
  • Role-specific dashboards for executives, managers and teams
  • Alerting and scheduled summaries
  • Handover documentation
Use cases

Where it fits

  • 01

    Production & line efficiency

    Output, material use and downtime in real time.

  • 02

    Sales & revenue

    Pipeline, win rates and forecasts in one view.

  • 03

    Workforce & utilization

    Hours, capacity and scheduling at a glance.

  • 04

    Grant & program reporting

    Milestones and outcomes ready for funders and boards.

Related project

See it in action

A specialized environmental project management application that coordinates watershed conservation initiatives, field data collection and milestone tracking, giving field teams, managers and funders one clear view of progress and impact.

Waterfall flowing into a forest stream
05Custom Web Application

Watershed Project Management

Pintails

A specialized environmental project management application that coordinates watershed conservation initiatives, field data collection and milestone tracking, giving field teams, managers and funders one clear view of progress and impact.

  • Multi-project milestone tracking
  • Field-ready data collection
  • Stakeholder & grant reporting
  • Centralized compliance records
  • Next.js
  • Mapping
  • Offline forms
  • Reporting
FAQ

Dashboards questions

Answers to the questions we hear most about real-time dashboards.

  • No. We design the right-sized data layer for your organization, which is often far simpler than a full warehouse.

  • Spreadsheets, SQL databases, accounting platforms, CRMs, ERPs, Microsoft 365 and most SaaS tools with an API or export.

  • It depends on the source. Many update every few minutes; others refresh hourly or daily. We match refresh rates to how quickly decisions need to be made.

  • Yes. We work in Power BI when it suits your organization, or build custom web dashboards when you need more flexibility or want to embed them in your own platform.

  • Access is role-based. Executives, managers and teams each see the views and level of detail appropriate to them.

Explore other services

Let's build together

Let's talk about your dashboards.

Book a free 30-minute discovery call. It's a working conversation, not a sales pitch. We'll look at where your team is losing time and map the smallest useful next step.

  • Free, no-obligation call
  • Reply within one business day
  • Data hosted in Canada